Decoding Kaplan-Meier Survival Analysis: A Critical Examination of Its Use and Misuse in Cancer Trials

The biotech world thrives on optimism. Pitch decks brimming with breakthroughs and life-saving treatments are a staple of the industry’s courtship of investors. Central to these presentations, particularly in oncology, is a venerable statistical tool: the Kaplan-Meier survival curve. Its simplicity and visual appeal make it the star of many slides, where it is wielded to showcase the efficacy of new therapies. Yet, like any tool, it can be misused.
In the hands of overly enthusiastic startups—or less scrupulous operators—Kaplan-Meier curves are often selectively presented to exaggerate benefits and downplay limitations. The consequences of such misrepresentation ripple far beyond financial investments. They shape regulatory decisions, steer patient care, and, in some cases, redirect the course of innovation.
Kaplan-Meier Unpacked
The Kaplan-Meier estimator is a statistical method developed in the 1950s to measure survival probabilities over time, even when some patient outcomes are unknown due to loss to follow-up (known as censoring). The survival function S(t)S(t)S(t) is calculated as:
$$S(t)=∏ti≤t(1−dini),S(t) = \prod_{t_i \leq t} \left( 1 - \frac{d_i}{n_i} \right),S(t)=ti≤t∏(1−nidi)$$
Where:
- t(i) is the time of the i-th event,
- di(d) is the number of events (e.g., deaths) at t(i),
- n(i) is the number of patients at risk just before ti.
The result is a stepwise curve that reveals the proportion of patients surviving over time. Its elegance lies in its ability to accommodate incomplete data, making it indispensable in clinical trials where patient follow-up is often irregular.
In oncology, Kaplan-Meier curves are used to compare the survival outcomes of a new treatment against standard care. But while the curves may seem straightforward, the stories they tell depend heavily on what is shown—and what is left out.
How Kaplan-Meier Curves Shape Biotech Pitches
Kaplan-Meier curves frequently take center stage in biotech pitch decks, presented as evidence of a treatment’s efficacy. A typical example might show two survival curves, one for the experimental treatment and another for standard care. The space between them is meant to represent hope—a longer life, a better chance of survival.
Consider a hypothetical cancer therapy. The median survival for patients receiving the new treatment is 12 months, compared to 9 months for those on standard care. The company highlights this 3-month improvement as a testament to its drug’s potential. Yet this metric, while intuitively appealing, can be misleading.
The Perils of Median Survival
Median survival is the time at which 50% of patients in a group have died. It is easy to understand and widely used in clinical research. But as a single point on a curve, it obscures the overall survival trajectory.
For instance, if the survival curves for the new treatment and standard care overlap for the first six months, the benefits of the therapy do not materialize until halfway through the median survival period. Such a delay could mean that patients with more aggressive disease, who might die within those six months, derive no benefit at all. Furthermore, focusing solely on median survival fails to account for the possibility that the curves converge—or even cross—after the median point.
Cherry-Picking Time Points
Another common tactic is to emphasize survival probabilities at specific time points. In the example above, suppose the 12-month survival rates are 60% for the new treatment and 50% for standard care—a 10% absolute improvement. While this sounds impressive, it may not reflect the full picture. What happens at 24 months, when both groups have survival rates of 10%? Cherry-picking time points can distort perceptions of long-term efficacy, especially if survival curves eventually converge.
The Issue of Censoring
Censoring is another area ripe for exploitation. Kaplan-Meier curves account for patients who drop out of a study or are lost to follow-up by treating them as still alive at their last known time point. This allows researchers to include incomplete data, but it also introduces opportunities for manipulation. Selectively censoring patients with poor outcomes can artificially inflate survival estimates. For example, if several patients in the treatment group leave the trial early due to adverse effects or disease progression, their absence could create a misleading plateau in the survival curve.
A Visual Illustration
The following table outlines survival probabilities for a hypothetical cancer trial comparing two treatments:
| Time (Months) | Treatment A Survival (%) | Treatment B Survival (%) |
|---|---|---|
| 0 | 100 | 100 |
| 6 | 80 | 70 |
| 12 | 60 | 50 |
| 18 | 40 | 30 |
| 24 | 20 | 10 |
The corresponding Kaplan-Meier curves can be visualized using LaTeX:
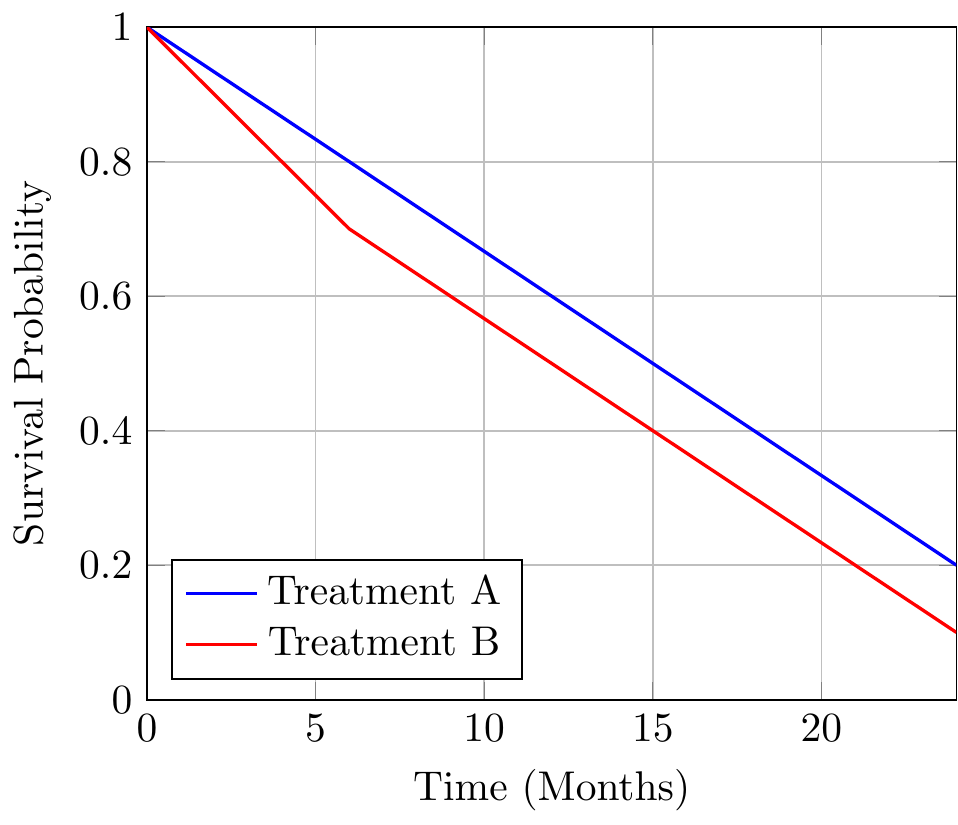
This plot reveals a more nuanced picture. The curves for Treatments A and B diverge after six months, indicating a delay in the new therapy’s benefits. At 24 months, the difference between the groups is negligible.
Beyond Kaplan-Meier: Alternative Metrics
Kaplan-Meier curves are powerful but incomplete. Complementary metrics like restricted mean survival time (RMST) can offer a fuller picture. RMST measures the total survival benefit up to a specific time τ:
$$RMST=∫0τS(t) dt.\text{RMST} = \int_0^\tau S(t) \, dt.RMST=∫0τS(t)dt$$
In our example, RMST might reveal that the new therapy provides only a modest increase in total survival time, tempering the enthusiasm generated by its median survival improvement.
The Stakes of Misrepresentation
The misuse of Kaplan-Meier curves is not merely a statistical quibble; it has real-world consequences. Investors, swayed by selective presentations, may pour resources into treatments with limited benefits. Regulators, faced with incomplete data, might approve therapies that fail to deliver meaningful improvements. And patients, lured by promises of extended survival, could face disappointment—or worse.
Transparency is the antidote. Presenting full survival curves, clearly marking censored data, and using complementary metrics like RMST can help stakeholders make informed decisions. For an industry built on hope, honesty is its most valuable currency.
Member discussion