Progression-Free Survival: The Metric That Divides Science, Business, and Payors

Few metrics in modern oncology trials command the prominence of progression-free survival (PFS). As a measure of time until disease progression or death, PFS is beloved by clinical researchers for its speed and by companies for its clarity in demonstrating efficacy. For regulators, it is a convenient proxy, standing in for the longer timelines required to observe overall survival (OS). But for payers—those who must fund these treatments—PFS often inspires skepticism, if not outright disdain. Its appeal in the clinical and corporate worlds often fails to translate into meaningful value in the real one.
PFS in Theory: A Clinical Scientist’s Dream
PFS provides a practical measure of efficacy. By measuring the time from treatment initiation until disease progression (or death, if it occurs first), PFS avoids the delays and complexities associated with OS. The Kaplan-Meier survival function for PFS is defined as:
$$PFS(t)=∏ti≤t(1−dini),\text{PFS}(t) = \prod_{t_i \leq t} \left( 1 - \frac{d_i}{n_i} \right),PFS(t)=ti≤t∏(1−nidi)$$
Where:
- ti is the time of the i-th progression or death,
- di is the number of events at tit,
- ni is the number of patients at risk just before tit.
PFS excels in trials where OS may be confounded by subsequent treatments or require prohibitively long follow-up periods. For instance, in aggressive cancers like metastatic colorectal cancer, where progression typically precedes death by months, PFS offers a quicker and statistically robust endpoint.
A Kaplan-Meier plot of PFS typically shows the proportion of patients free from progression over time. Consider the following data:
| Time (Months) | Group A (New Drug) | Group B (Standard Care) |
|---|---|---|
| 0 | 100% | 100% |
| 6 | 70% | 50% |
| 12 | 40% | 20% |
| 18 | 20% | 10% |
The resulting plot might look like this:
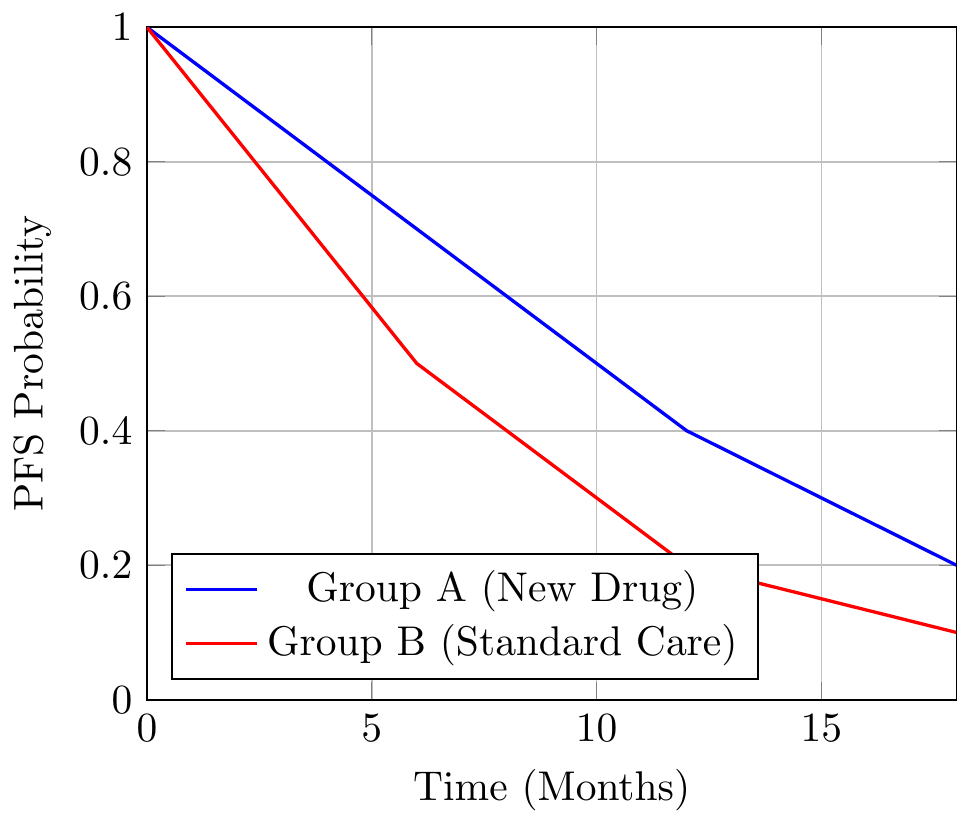
This plot shows a clear advantage for Group A, which delays progression by several months. The simplicity is seductive, but it obscures complexities that often render PFS far less convincing in practice.
PFS in Practice: A Corporate Reporting Staple
In pitch decks, PFS is frequently highlighted as evidence of a new therapy’s efficacy. The above example might be summarized as: “Group A improves PFS by 4 months compared to standard care—a 100% improvement.” This framing has a rhetorical flourish that impresses investors but raises eyebrows among scientists and payers.
Selective Emphasis on Medians
The median PFS—defined as the time at which 50% of patients remain progression-free—is often overemphasized. While medians are easy to grasp, they tell a partial story. Two treatments with the same median PFS could have vastly different survival dynamics beyond that point.
For instance, if Treatment A extends PFS by 2 months (from 6 months to 8 months), the improvement may seem significant. But if the curves converge shortly thereafter, this “benefit” could vanish in the long run.
Cherry-Picking Time Points
Companies often focus on survival probabilities at specific time points:
- At 12 months, Group A’s PFS is 40% versus Group B’s 20%.
- This 20% absolute improvement sounds impressive, but by 18 months, the difference shrinks to 10%.
Selective reporting of favorable time points misrepresents the overall efficacy, a particularly common tactic in investor presentations.
PFS from the Payer’s Perspective
For payers, the skepticism surrounding PFS stems from its lack of correlation with real-world value. Extending the time before progression has limited appeal unless it translates into longer survival, improved quality of life, or reduced healthcare costs.
Small Gains, Big Costs
Consider a drug that extends PFS by 2 months but costs $200,000 per patient annually. From a payer’s perspective, this might result in an unsustainable incremental cost-effectiveness ratio (ICER). If no corresponding improvement in OS or quality-adjusted life years (QALYs) occurs, the value proposition becomes indefensible.
Surrogate Endpoints Gone Awry
Payers have long been wary of surrogate endpoints. Bevacizumab (Avastin) in breast cancer is a cautionary tale. The drug significantly improved PFS, but subsequent analyses showed no benefit in OS or quality of life. The FDA eventually withdrew its approval for this indication, leaving payers to question the utility of paying for therapies based solely on PFS data.
The Divergence Between Clinical Science and Payors
The clinical world embraces PFS because it accelerates trial timelines and provides regulators with an intermediate endpoint to assess. Yet, payers demand evidence of tangible benefits. The disconnect lies in differing priorities:
- Clinicians value statistical rigor and feasibility.
- Companies emphasize metrics that maximize marketability.
- Payers require real-world impact.
Misaligned Incentives
Companies seeking rapid regulatory approval and market access often report PFS as their primary endpoint. Regulators may grant accelerated approvals based on PFS, leaving payers to absorb the financial risk if subsequent data fail to show OS benefits. This creates a gap between regulatory greenlights and payer acceptance, delaying patient access.
Conclusion
Progression-free survival occupies a unique and contentious place in oncology. For clinical scientists, it is a practical and statistically sound endpoint. For companies, it is a persuasive marketing tool. For payers, however, it remains a metric of questionable relevance. As long as PFS dominates oncology reporting, the debate over its real-world value will continue, with patients, ultimately, caught in the middle.
Member discussion