Tail Risks in Drug Development: Case Studies and Lessons Learned

Drug development requires vast investments of capital and time. Even after extensive research and clinical testing, unforeseen safety problems or unexpectedly high efficacy in niche populations can dramatically alter a drug’s commercial and therapeutic trajectory. Traditional statistical methods typically focus on the mean or median response, but it is often the “tail” events—those that deviate most sharply from the average—that determine success or failure.
1. Conventional Models and Their Shortcomings
1.1 Limitations of Traditional Analyses
Conventional statistical methods in clinical trials often assume normally distributed data. While these assumptions simplify calculations and work well for typical patient responses, they fall short in capturing:
- Rare Adverse Events: Severe toxicities might be overlooked under a Gaussian framework.
- Exceptional Efficacy: Breakthrough outcomes in small patient subgroups may be misclassified as statistical anomalies rather than meaningful signals.
By concentrating on the bulk of the data, traditional methods risk underestimating rare, high-magnitude events—both negative and positive.
2. Fundamentals of Extreme Value Theory (EVT)
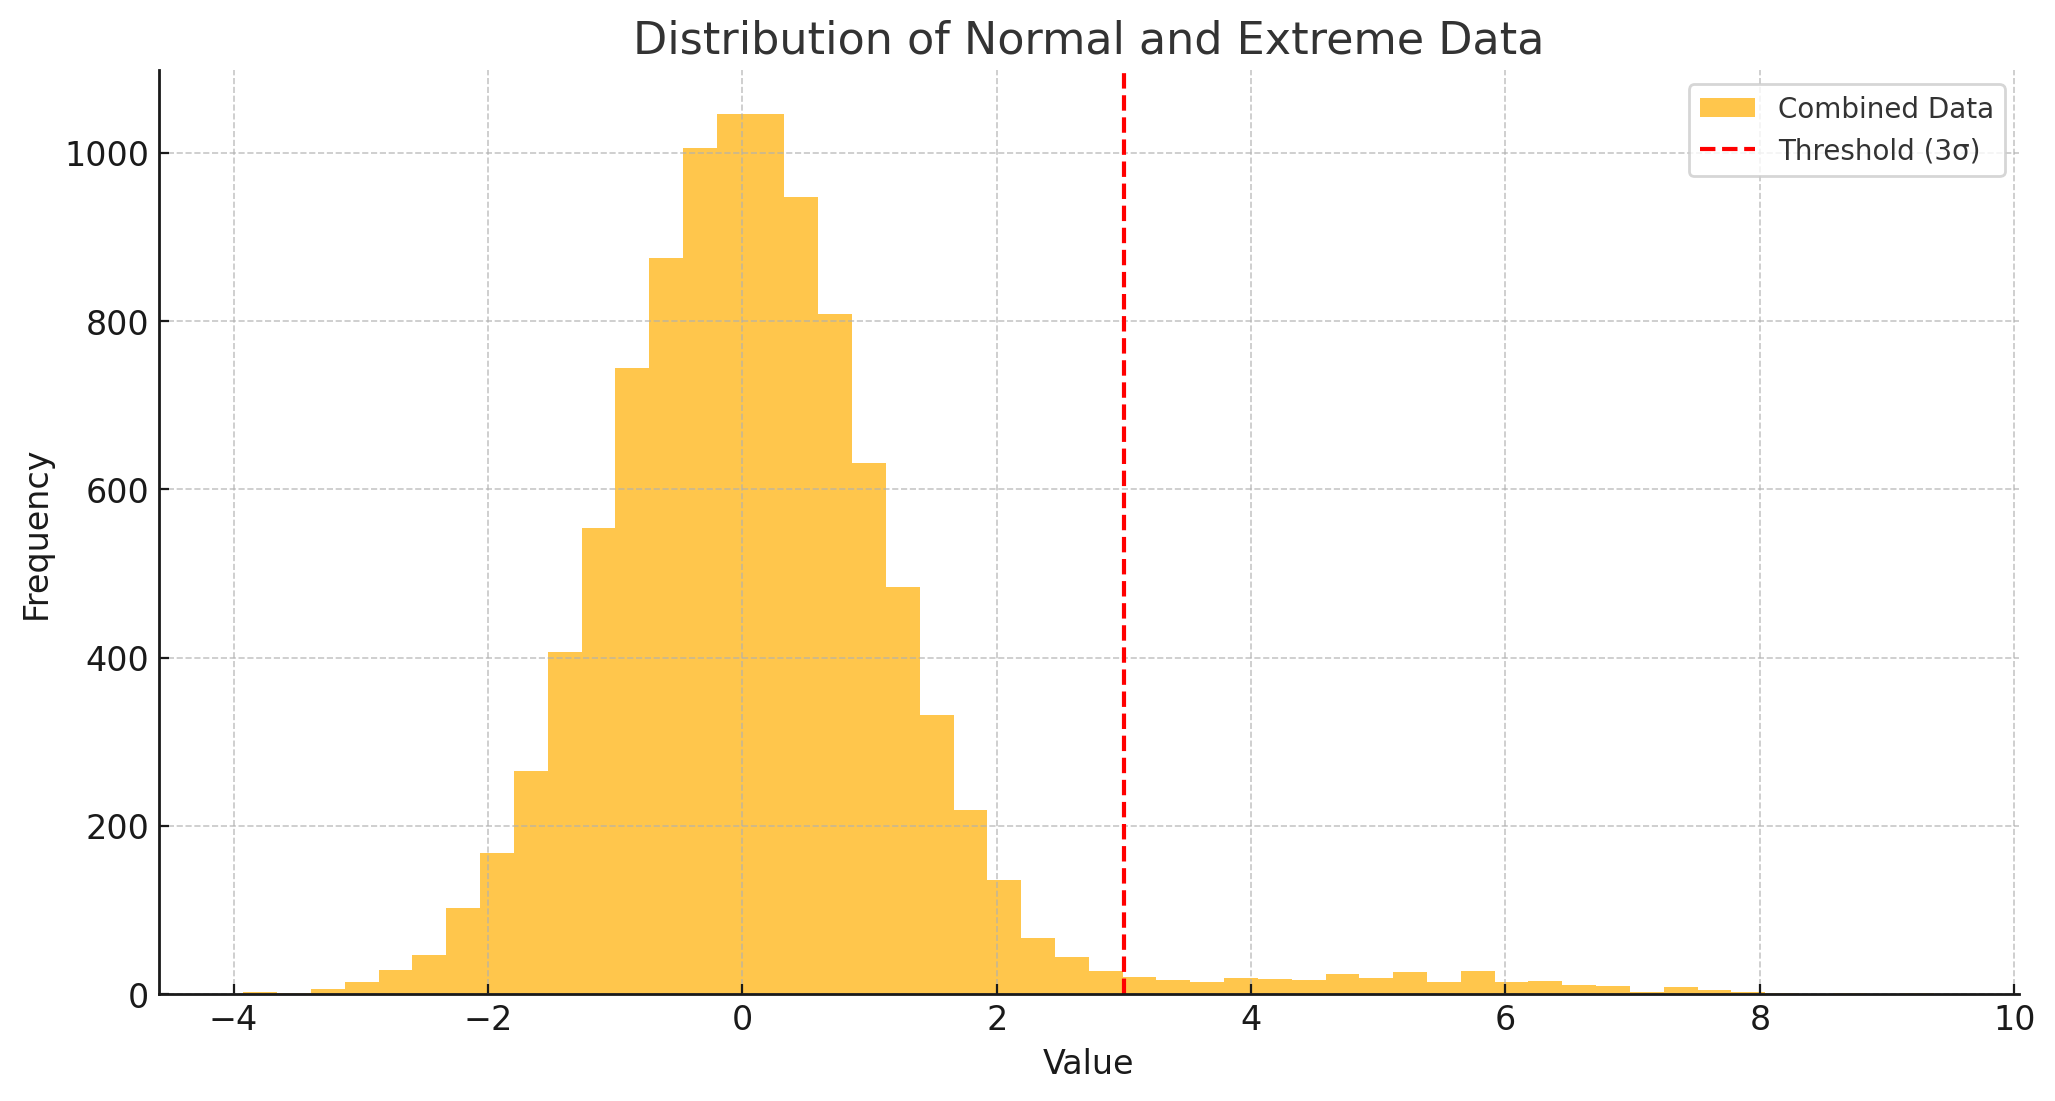
EVT specializes in analyzing the most extreme observations in a dataset—those in the tails of a probability distribution. Rather than dismissing these outliers as noise, EVT provides structured tools to model their frequency and severity.
2.1 Types of Extreme Value Distributions
EVT revolves around three key distributions, each suited to different tail behaviors:
- Gumbel Distribution (Type I)
- Tail: Exponential decay.
- Use: Moderately extreme events, such as elevated side effects that exceed typical ranges.
- Clinical Example: Detecting secondary toxicities that are concerning but not catastrophic.
- Fréchet Distribution (Type II)
- Tail: Heavy-tailed (decays via a power law).
- Use: High-magnitude, low-frequency events.
- Clinical Example: Modeling catastrophic adverse reactions, such as anaphylaxis.
- Weibull Distribution (Type III)
- Tail: Finite upper bound.
- Use: Reliability analysis, bounded biological measures.
- Clinical Example: Certain biomarkers that cannot exceed a known physiological limit.
2.2 The Generalized Extreme Value (GEV) Distribution
Crucially, these three distributions can be unified under the Generalized Extreme Value (GEV) distribution. Its shape parameter, ξ, determines which tail behavior is most appropriate:
- ξ>0: Fréchet (heavy-tailed)
- ξ=0: Gumbel (exponentially-tailed)
- ξ<0: Weibull (bounded)
This flexibility allows researchers to model diverse datasets without forcing inappropriate assumptions.
3. Core EVT Approaches in Drug Development
EVT is a branch of statistics dedicated to studying the extreme values in a dataset—those observations in the tails of a probability distribution. Unlike traditional models that center on the bulk of the data, EVT focuses on rare, high-magnitude events, offering methods to model their frequency and severity.
3.1 Peaks Over Threshold (POT) and the Generalized Pareto Distribution (GPD)
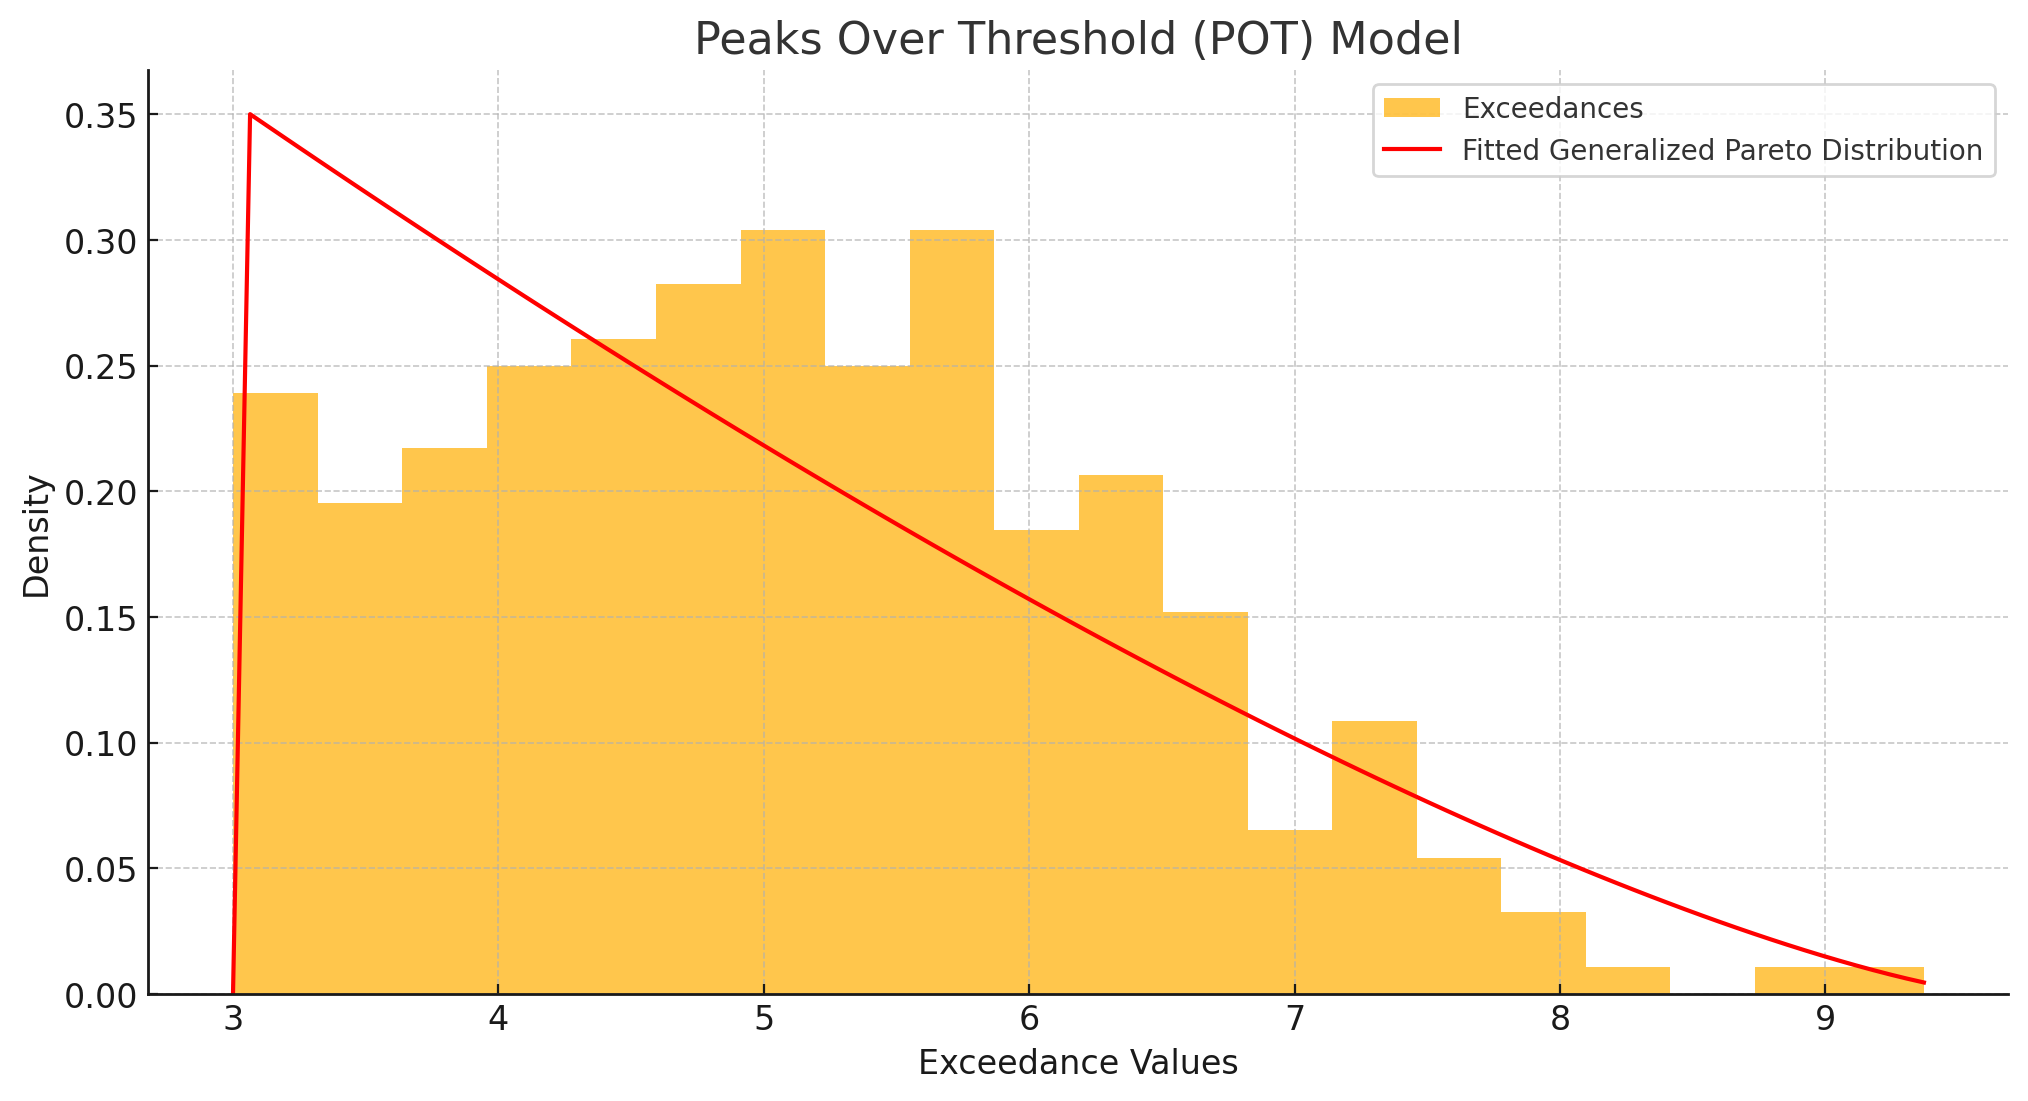
Peaks Over Threshold (POT) is a method within Extreme Value Theory (EVT) specifically developed to focus on and analyze data points that exceed a predefined threshold, allowing for a detailed examination of the distribution and frequency of extreme values. he amount by which an observation xxx surpasses uuu is called the exceedance y=x−u. These exceedances are then modeled using the Generalized Pareto Distribution (GPD), with CDF:
- y=x−u is the exceedance over threshold u.
- ξ (xi) is the shape parameter.
- σ (sigma) is the scale parameter (sometimes denoted β).
- y≥0 only model observations above the threshold.
3.1.2 Threshold Selection
Choosing the appropriate threshold uuu is critical:
- Statistical: Mean excess plots, stability checks, and goodness-of-fit tests help ensure a consistent tail model.
- Clinical: A threshold could be a 3× elevation of a liver enzyme, signifying a clinically meaningful “danger zone.”
3.1.3 Applications
In immunotherapy trials, cytokine levels exceeding a certain threshold may indicate severe toxicity. GPD models can estimate both the probability and severity of these events, supporting better trial monitoring and participant safety.
3.2 Block Maxima Model
3.2.1 Mechanics
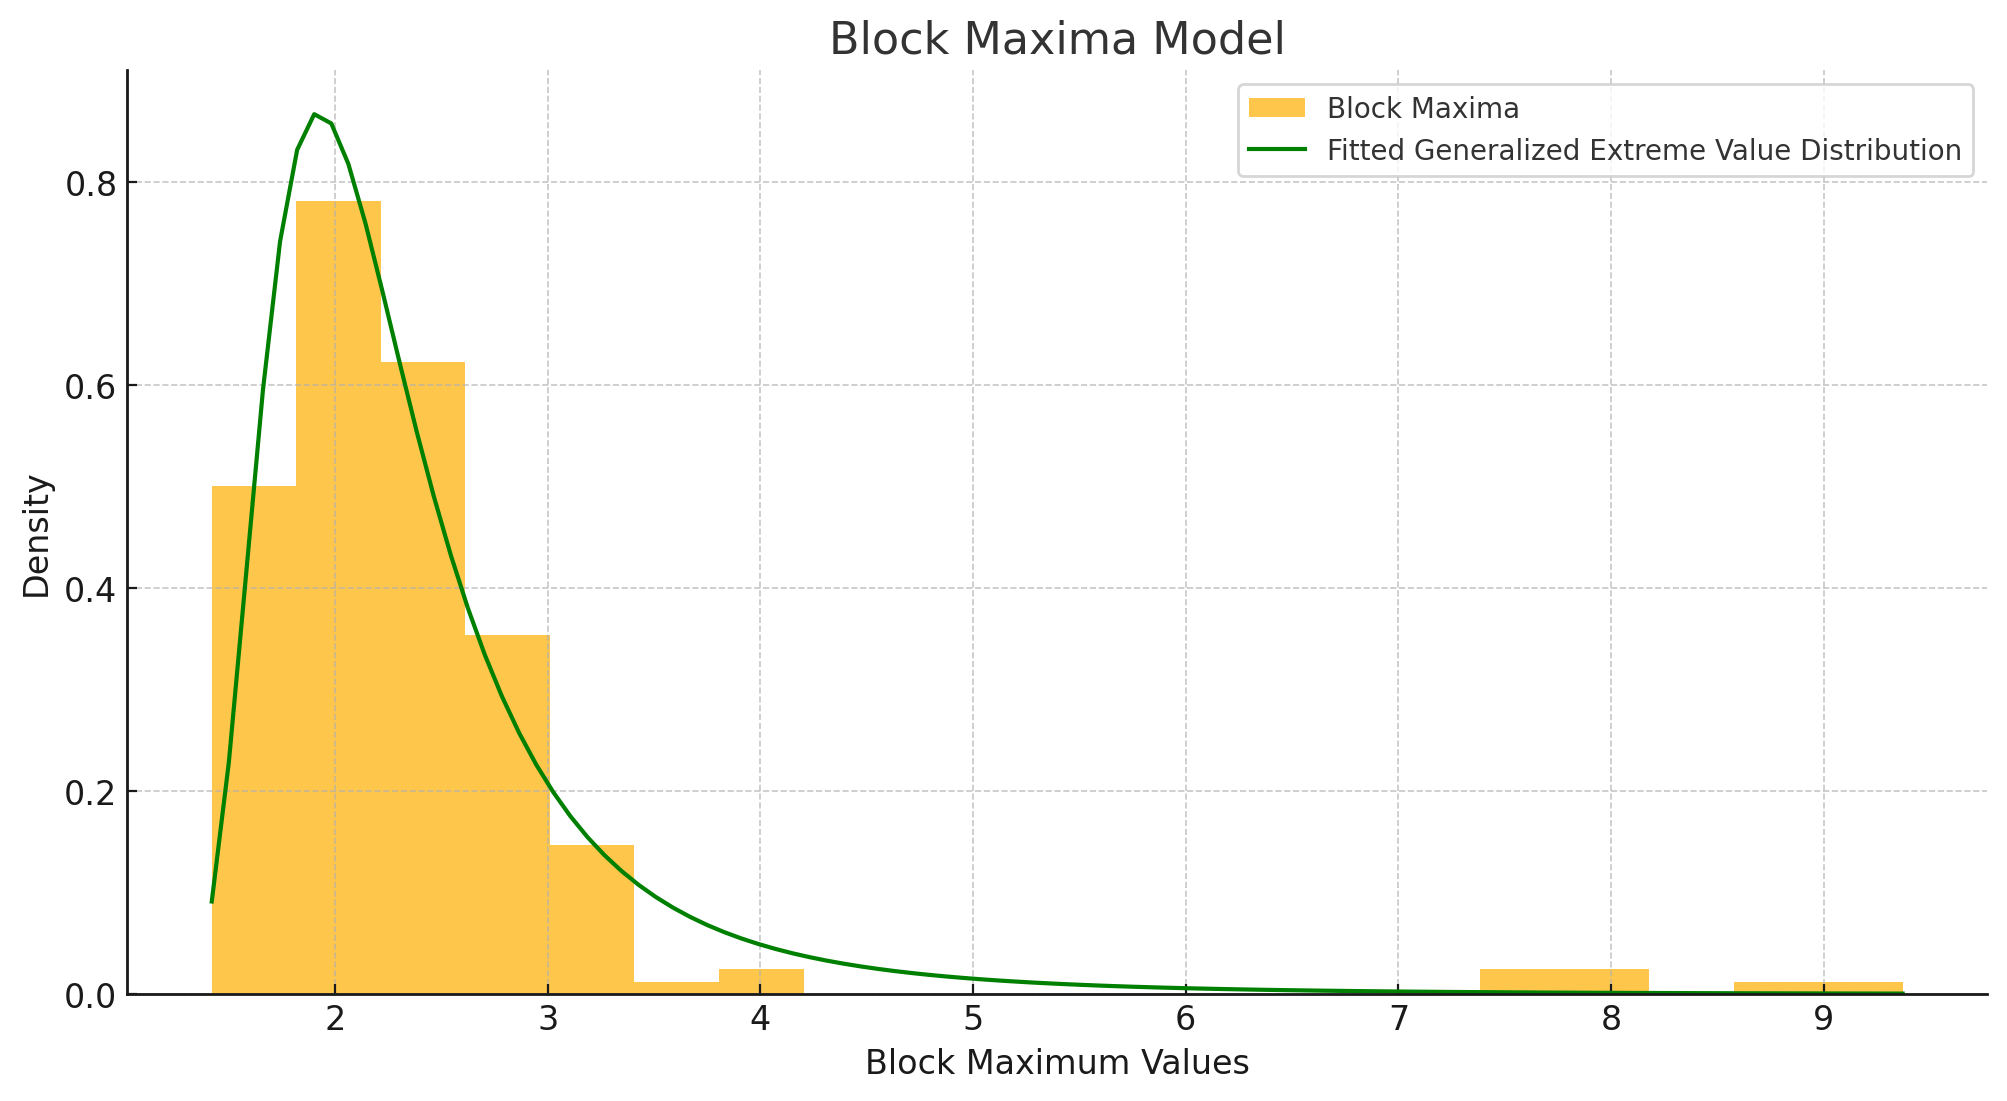
In the Block Maxima method, data are divided into equally spaced blocks (e.g., monthly intervals). The maximum (or minimum) within each block is then extracted and modeled using the GEV distribution. This approach is valuable for examining how extreme values change over time or across different trial phases.
3.2.2 Block Size Considerations
- Statistical: Block size should allow GEV’s asymptotic assumptions to hold and maintain independence among blocks.
- Practical: Often aligns with how data are gathered in clinical settings (e.g., monthly lab assessments, quarterly safety reviews).
3.2.3 Applications
- Safety Profiles Over Time: Tracking monthly “worst-case” toxicities can pinpoint when (and among which patient subgroups) severe events are most likely.
- Longitudinal Efficacy: Reveals how quickly a therapy reaches its maximum observed benefit and whether this maximum is shifting across different trial stages.
4.Beyond Basic EVT: Advanced Statistical Tools
4.1 Generalized Additive Models for Location, Scale, and Shape (GAMLSS)
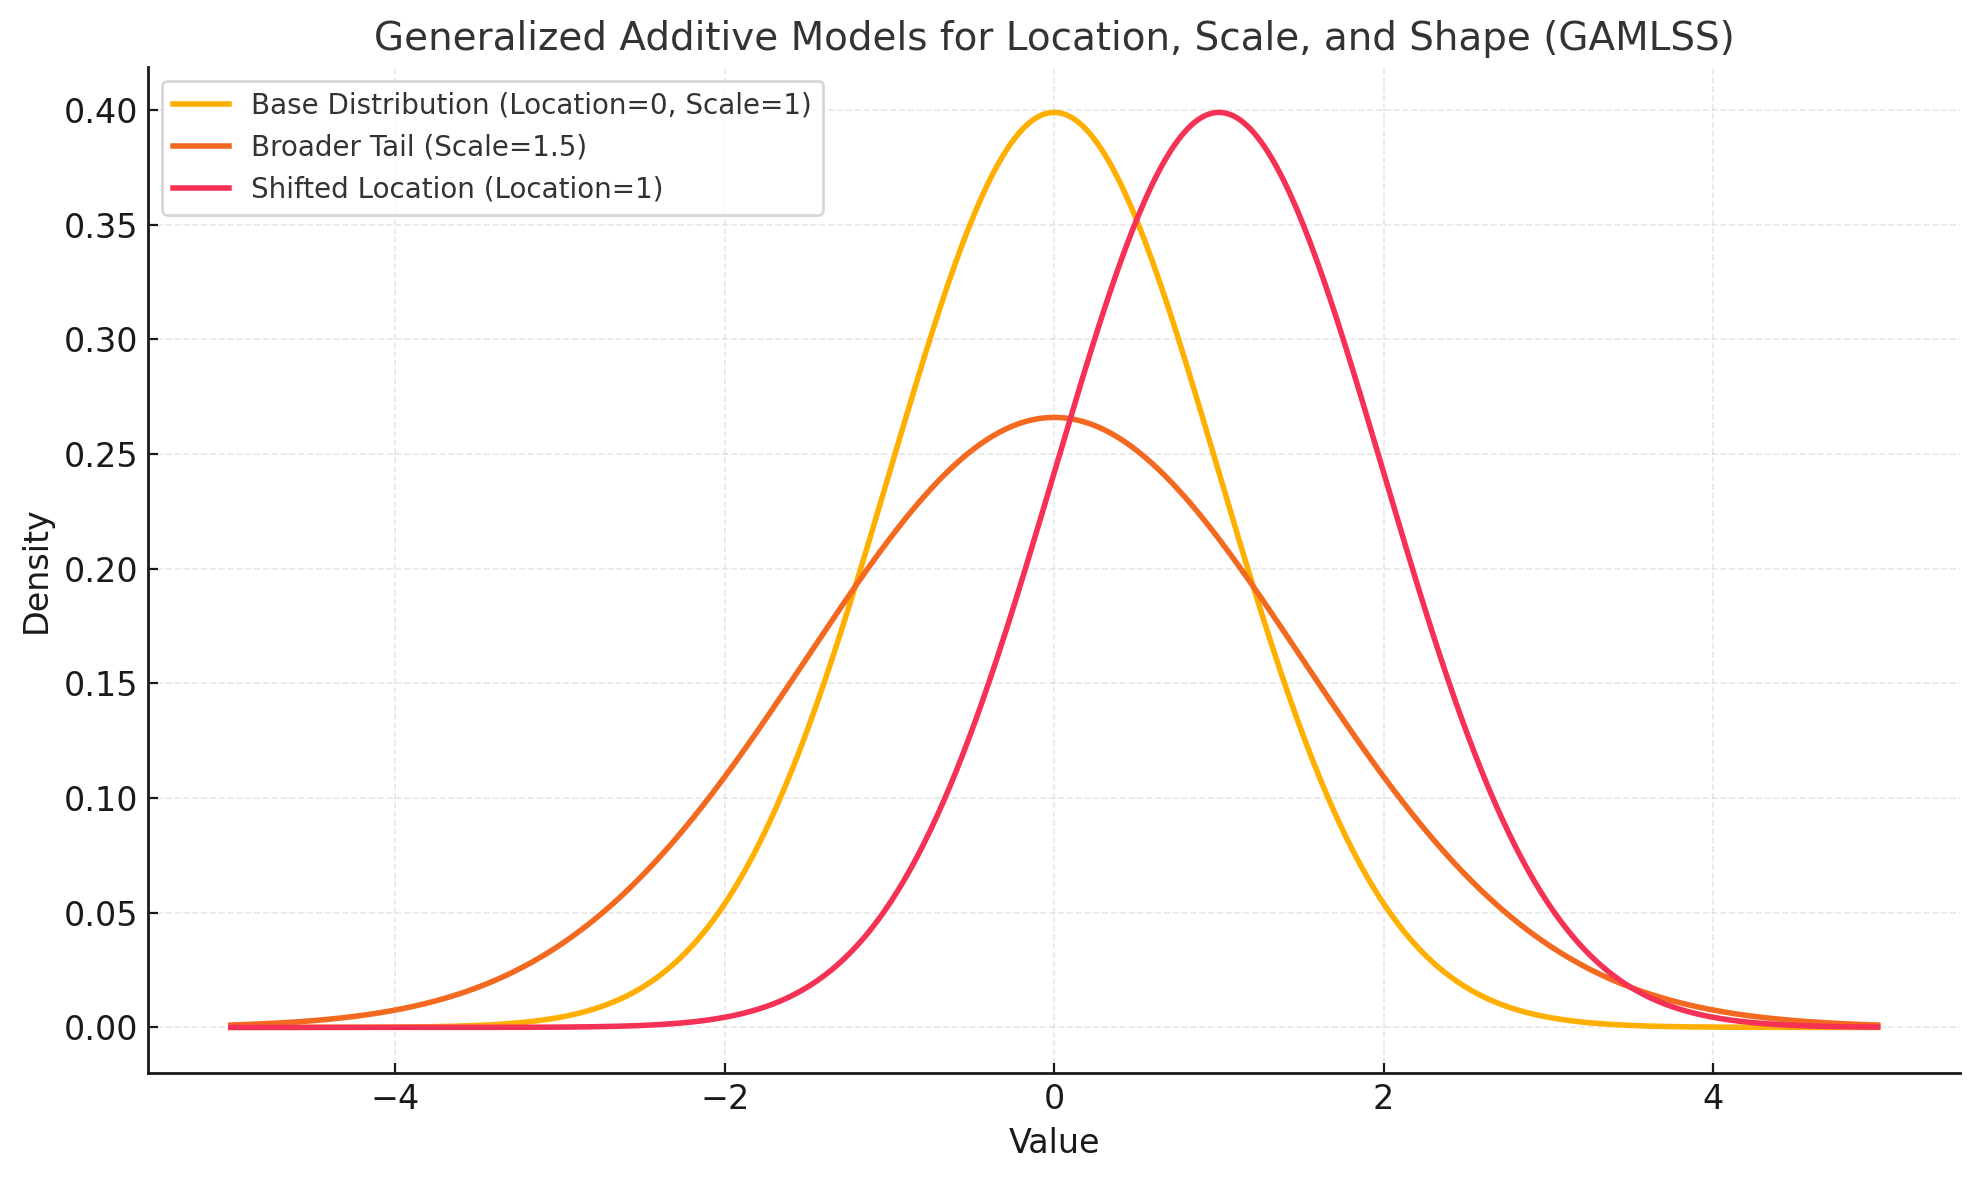
Classical regression focuses on a single parameter (usually the mean). GAMLSS, however, allows each component of the distribution—location (mean), scale (variance), and shape (skewness or kurtosis)—to vary with explanatory variables.
4.1.1 Component Modeling
- Location (μ): Where is the distribution centered? This parameter may shift based on dose or demographic factors.
- Scale (σ): How dispersed is the data? A new formulation might result in higher variability among patients.
- Shape (ν,τ): Are the data skewed or heavy-tailed? GAMLSS flexibly captures changes in distribution shape as additional information (e.g., biomarker levels) becomes available.
4.1.2 Clinical Trial Applications
In precision medicine, GAMLSS can model how a biomarker influences not just average response but also variability and tail behavior, offering insights into high-risk or high-benefit subgroups.
4.2 Particle Learning Methods
4.2.1 Real-Time Updates
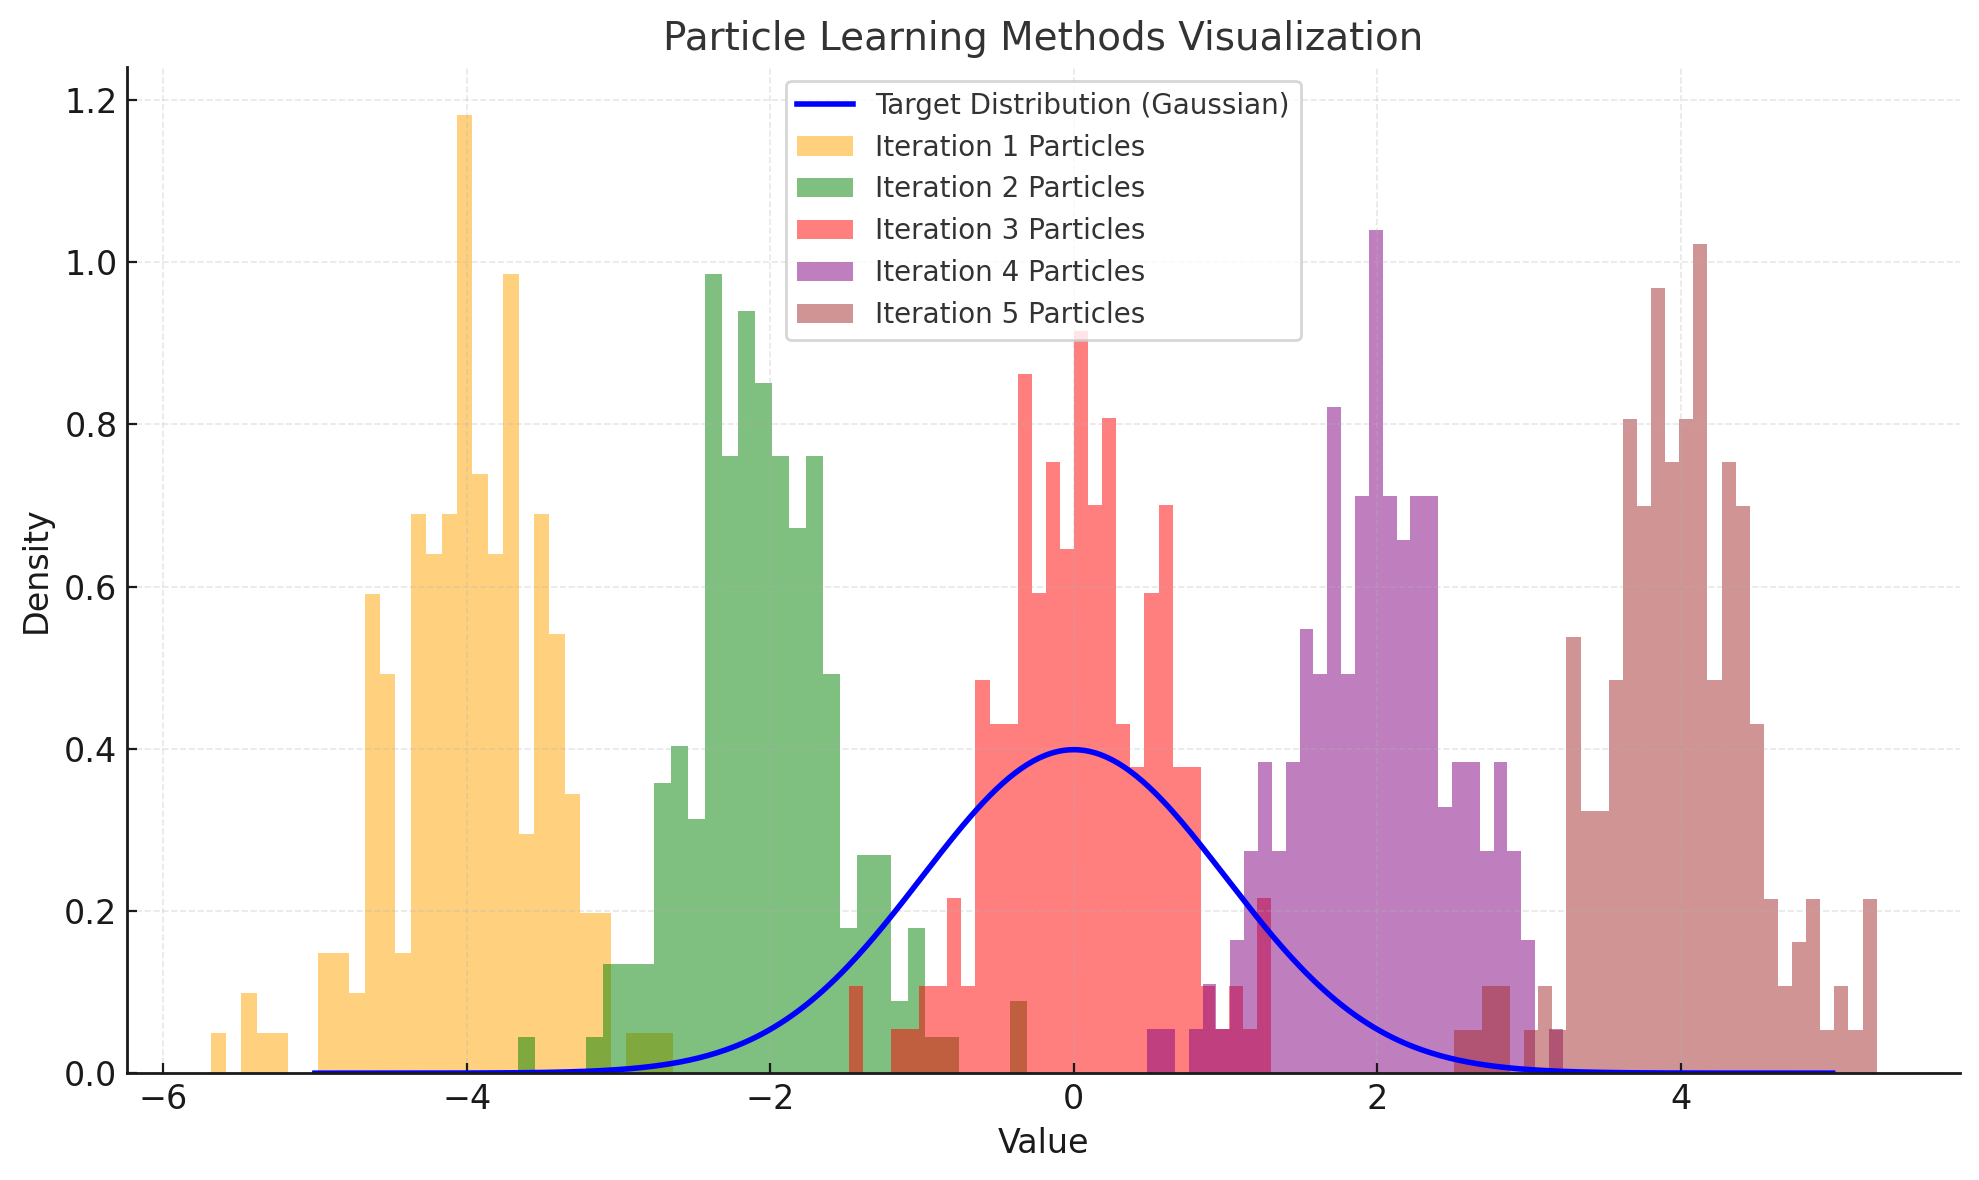
Particle learning employs sequential Monte Carlo simulations to iteratively update model parameters as new data arrive. When applied to fat-tailed distributions, it provides a dynamic way to monitor the evolution of extreme events.
4.2.2 Applications
- Adaptive Dose-Finding: If severe toxicity emerges early, dosing strategies can be modified in real time.
- Early Stopping Decisions: Clear signals of efficacy or futility—observed in the tails—can trigger an accelerated end to the trial, minimizing cost and patient risk.
- Dynamic Pharmacovigilance: As more patients access a new therapy, rare side effects may surface. Particle learning updates tail-risk estimates immediately, guiding regulatory action and labeling changes.
5. Real-World Examples
- Thalidomide Tragedy
Thalidomide’s link to severe birth defects in the late 1950s underscores the peril of overlooking tail events. Even rudimentary EVT-based checks might have flagged a small but devastating risk earlier, illustrating the stakes of inadequate safety assessments. - Serendipitous Success of Sildenafil (Viagra)
Originally intended for hypertension and angina, sildenafil’s remarkable effect on erectile dysfunction was a “tail event” that reshaped its commercial destiny. EVT methods, applied retroactively, highlight how the improbable can become transformational. - Drug-Induced Liver Injury (DILI)
Bromfenac was withdrawn after post-marketing data revealed severe hepatotoxicity. The GPD approach—focusing on extreme liver enzyme elevations—could have identified this danger threshold in earlier trials, avoiding a costly and reputationally damaging withdrawal. - mRNA Vaccines and Rare Myocarditis Cases
Rapid deployment of mRNA vaccines for COVID-19 revealed rare myocarditis instances. EVT-based analyses on real-world data provided a clearer picture of their frequency, guiding public-health advisories and post-marketing scrutiny.
6. Integrating EVT Across the Drug Lifecycle
6.1 Trial Design and Patient Stratification
Incorporating threshold-based monitoring at the outset helps spot severe risks sooner and identify subgroups more susceptible to extreme outcomes—or more likely to show extraordinary benefits.
6.2 Regulatory Engagement
Agencies have grown increasingly sensitive to tail risks. Sponsors who present EVT-driven analyses often bolster their submissions, demonstrating preemptive safeguards against severe adverse events or confirming the potential for exceptional efficacy.
6.3 Post-Marketing Surveillance
After a drug reaches the market, the broader patient base can reveal hidden vulnerabilities or unexplored benefits. Extending EVT methods to real-world data—via health records or spontaneous adverse-event reporting—sharpens pharmacovigilance and informs ongoing risk management.
Key Benefits of EVT in Clinical Research
- Enhanced Safety: Identifies and quantifies the probability of severe adverse events, bolstering trial oversight and protecting patients.
- Optimized Efficacy: Pinpoints small cohorts with remarkable responses, clarifying the boundaries of potential therapeutic benefits.
- Efficient Resource Allocation: Offers investors and sponsors a data-driven perspective on risk and reward, guiding smarter funding decisions.
- Adaptive and Forward-Looking: Facilitates ongoing model updates, supporting real-time course corrections in clinical trials and post-marketing surveillance.
Conclusion
Employing a diverse set of statistical tools to address fat-tailed distributions is critical in modern drug development. Extreme Value Theory (EVT), along with advanced methods such as GPD, Block Maxima, GAMLSS, and particle learning, equips researchers, regulators, and investors to better anticipate and manage rare but impactful events. By embracing the insights hidden in the tails of distributions, the industry is poised to design safer trials, expedite regulatory success, and ultimately deliver more effective treatments to patients worldwide.
Member discussion