Unveiling the Limitations of Survival Analysis: A Closer Look at Hazard Ratios, Cumulative Incidence, and RMST

Hazard ratios (HRs) are a widely used measure in survival analysis, summarizing the relative risk of an event occurring in two groups over time. Despite their popularity, hazard ratios rest on fragile assumptions and can lead to oversimplified interpretations. This critique examines the statistical limitations of HRs, supplemented with illustrative formulas and visualizations, and concludes with an exploration of fat-tailed risk dynamics.
1. The Assumption of Proportional Hazards
Hazard ratios rely on the proportional hazards assumption, which posits that the hazard rates between two groups remain proportional over time. Mathematically, this is expressed as:
$$S(t) = e^{-h(t) t}, \quad \text{where } h(t) = \lambda$$
The hazard ratio is defined as:
$$\frac{h_1(t)}{h_2(t)} = \text{constant} = \text{HR}$$.
Illustration of Survival Curves with Proportional Hazards
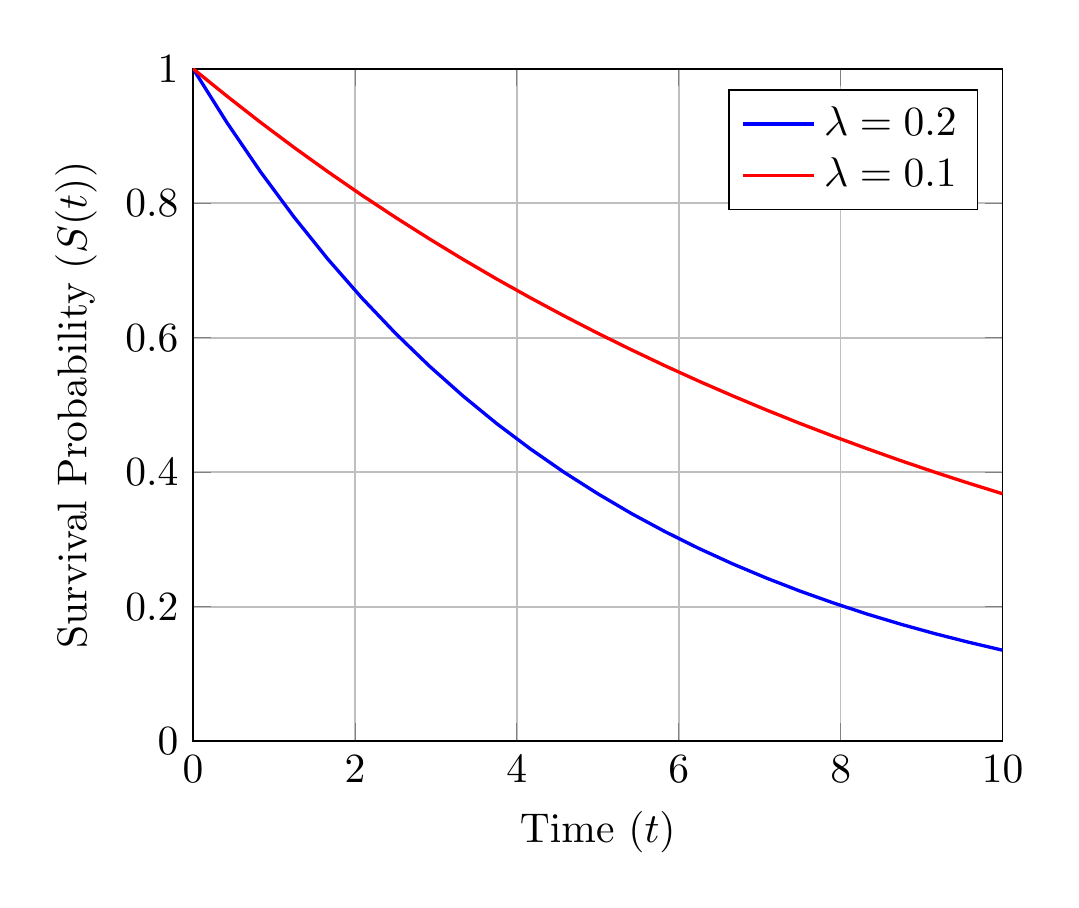
In practice, real-world data often violate the proportional hazards assumption, leading to potential misinterpretation when using HRs as a summary statistic.
2. The Problem of Relative vs. Absolute Measures
Hazard ratios quantify relative differences in risk, which can obscure the practical importance of absolute changes in survival probabilities. The absolute risk reduction (ARR) is a more interpretable metric:
$$\text{ARR} = S_{\text{control}}(t) - S_{\text{treatment}}(t)$$.
Illustration of Absolute Risk Reduction
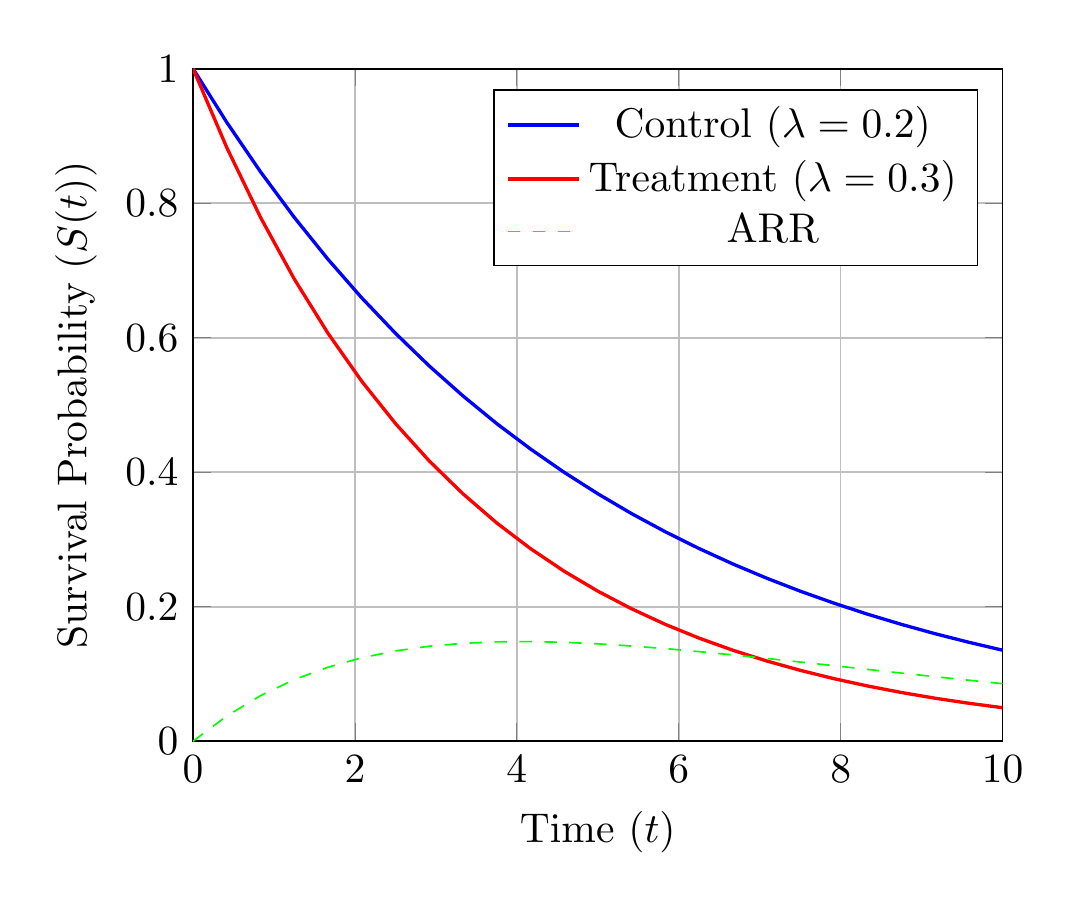
Without absolute measures, the clinical relevance of hazard ratios becomes difficult to assess.
3. Cumulative Incidence and Survival Analysis
The cumulative incidence function, F(t)F(t)F(t), represents the probability of experiencing an event by time ttt, complementing survival probabilities:
$$F(t) = 1 - S(t), \quad \text{where } S(t) = e^{-h(t) t}$$.
Illustration of Cumulative Incidence
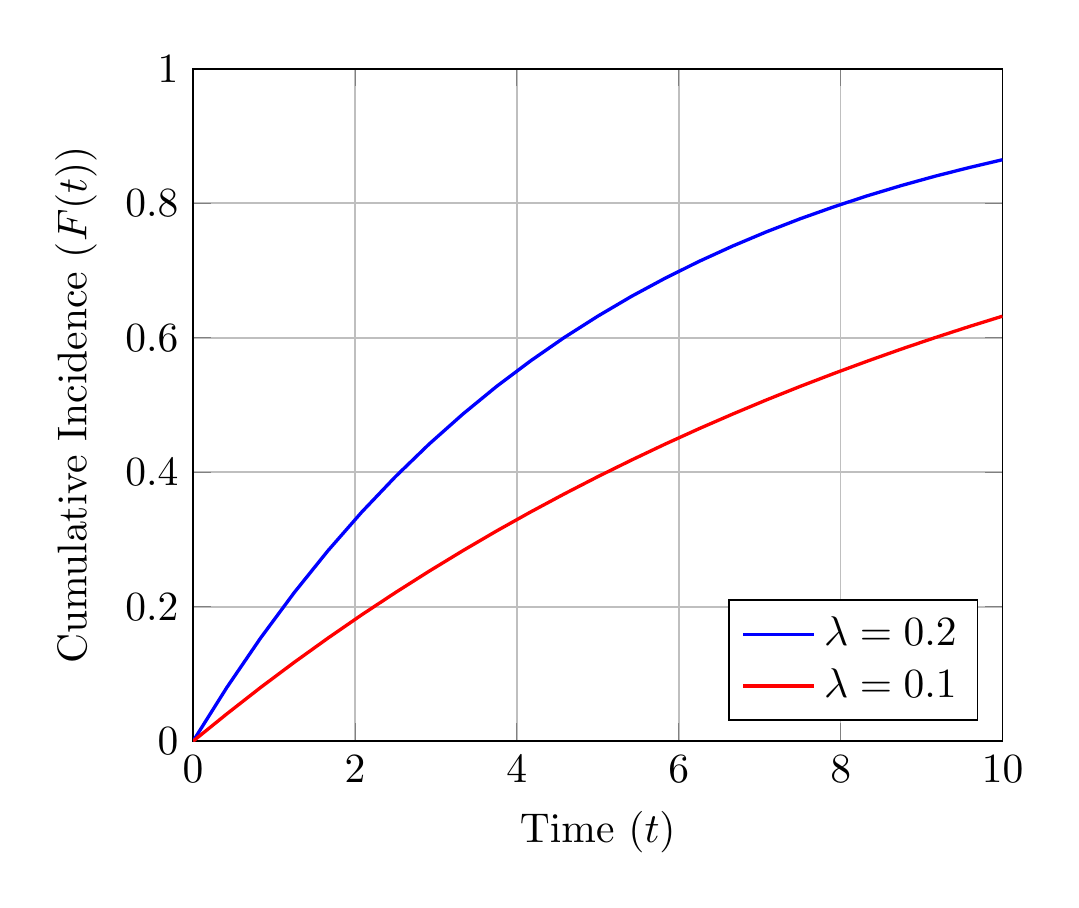
Cumulative incidence functions provide a more intuitive representation of event probabilities than hazard ratios alone.
4. Time-Averaged Metrics: Restricted Mean Survival Time (RMST)
To address the limitations of proportional hazards, the restricted mean survival time (RMST) offers an average survival estimate over a fixed time horizon:
$$\text{RMST} = \int_0^\tau S(t) \, dt,$$
where τ is the time horizon.
Illustration of RMST
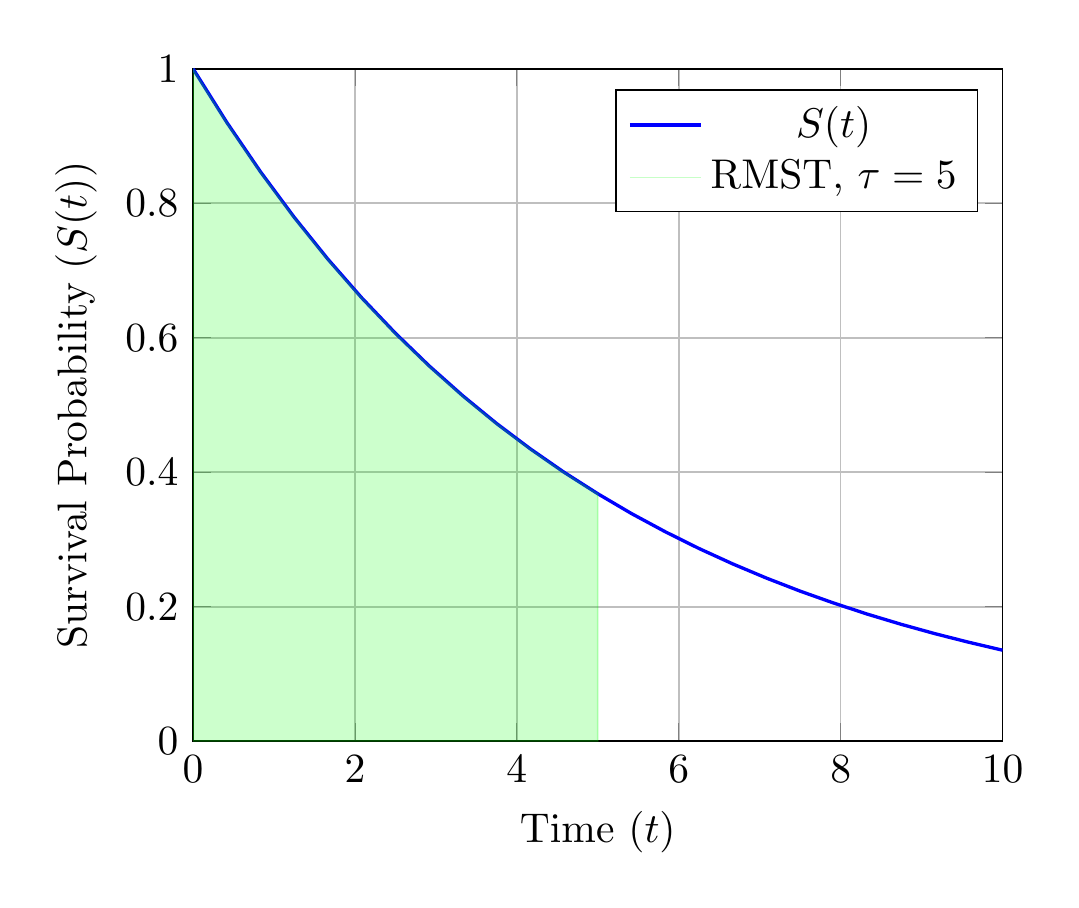
RMST is particularly useful in cases where proportional hazards cannot be assumed.
5. Fat-Tailed Risk Analysis in Survival Data
Hazard ratios implicitly assume that risk distributions are well-behaved and do not account for fat-tailed risks, where extreme but rare events dominate outcomes. In such cases, traditional survival models may underestimate the probability of catastrophic events or overestimate the impact of interventions.
In fat-tailed distributions, the hazard rate, h(t)h(t)h(t), may exhibit non-linear scaling, as seen in heavy-tailed probability density functions (PDFs):
$$P(X > x) \sim x^{-\alpha}, \quad \alpha > 0$$.
This property fundamentally challenges proportional hazards and other parametric assumptions. To properly account for such risks, non-parametric approaches or extreme value theory (EVT) can be applied:
$$F(x) = 1 - e^{-(x / \sigma)^\xi}, \quad \text{for } \xi > 0$$.
These models provide more accurate representations of tail events, especially in high-risk domains like oncology and cardiovascular medicine.
Conclusion
Hazard ratios are a useful but limited tool for summarizing relative risks in survival analysis. Their reliance on proportional hazards, insensitivity to absolute differences, and inability to capture fat-tailed risks necessitate cautious interpretation. By incorporating alternative measures like ARR, RMST, and fat-tailed risk frameworks, analysts can better navigate the complexities of survival data and avoid oversimplified conclusions.
Member discussion